What an Ear actually sees
Before a sound gets a name, it becomes a picture. This is a spectrogram: time runs left to right, pitch runs bottom to top, and the brighter the mark, the louder that pitch was at that instant. Every Ear on this land reads shapes like these.
An illustration. These are synthesized tones, not recordings, but they are analyzed exactly the way an Ear analyzes real audio: a short-time Fourier transform over 64-millisecond windows. Real birdsong is messier than this. No audio from this property is published here, because none of it ever leaves the roof.
Heard on this roof
Every species included in the report, most-heard first. Each bar is shaded by model confidence. Possible matches remain retained but are excluded from reports.
Detections are counted at the microphone, not at the bird. Read these as acoustic activity, meaning how often something was heard, rather than as an estimate of how many birds are present.
How it works
Your land, your model. No servers to run, and no audio leaving the property.
An Ear records around the clock and names species right on the device, tuned to what's most likely on your land. Identification is built on Perch, Google's open-source bird-audio model (Apache-2.0). No audio ever leaves the property.
All that's published to this page is the result: the species and how sure it is. No recordings, no locations. It updates the moment a bird sings.
Place more Ears anywhere on the land. They relay through each other over long-range radio, so coverage grows into a full mesh across the property. Each Ear is set up for the species likely at that spot; that's decided when we build it, not learned over time.
The solar clock
Every hour's detections, read around a clock face. How far a wedge reaches out is how much was heard that hour; how dark it is is how many different species were part of it. Roughly when it's light sits behind them.
Who sings when
Each row is a species, each column an hour. Darker means more was heard in that hour.
A species whose rhythm contradicts its own biology is how we catch our own mistakes: anything diurnal showing up at 3am is a false positive, not a discovery.
The record, unedited
Every day the Ears have been up, including the days they weren't.
Where we are right now
Through 2026 we're running a small number of hands-on field studies on working land, always alongside the IPM, agronomy or restoration advisers a property already works with. We're not selling hardware this year. Individual Catbird Ears go on sale in 2027.
From one Ear to your whole property
Full-mesh coverage, and a biodiversity map of the ground in between
One Ear tells you what lives at one spot. Our next step is meshing several together and joining what they hear to your parcel's vegetation, terrain, water and soil data, to build a modeled biodiversity picture of the whole parcel, including the acres no microphone sits on. The modeling engine behind this is already running in our own testing. What's below is a preview of what a property-wide reading looks like as it comes into field studies.
A self-healing mesh
Every Ear relays through its neighbours over long-range radio. No wiring, no cell service, no dead zones. One gateway carries the detections out; it's the only thing that ever touches the internet. Place them where the land matters, not where the signal is.
Extrapolation between sensors
Each Ear hears its own ground. We're bringing a model into field studies that blends what every Ear detects with your parcel's vegetation, terrain, water and soil data to estimate what's using the land in between. The modeling itself is already working in our testing.
A property-wide record
The result will be a biodiversity surface for the whole parcel that sharpens every week the network runs, and can be re-run after any grazing, water or planting change. This is where the platform is headed next.
This is where a gadget turns into land intelligence. Acre-by-acre biodiversity you can put on a map, tie to a management unit, and measure again next season, on agricultural, grazing and conservation ground alike. It's the modeling layer we're actively bringing to field studies on top of the mesh above.
Still Habitat Field Studies
The same Ears, deployed as a working-lands study
That roof is my own house in the East Bay, where everything gets tested first. It has already named 22 species across 3,543 detections, running around the clock. That is the breadth. Take the same Ears onto grazing land and they do something sharper: find where wildlife uses the ground, tie it to forage, shade and water, then return after a grazing or restoration decision and measure what changed. Same instrument, pointed at a question.
The roof's own guild layers
Every layer, occupied
The same 22 species and 3,543 detections from the roof above, sorted into the layer each one mostly forages in: ground and litter, shrub and understory, canopy, or the air above. Real counts; the layer each species goes in comes from published natural history, not anything the ear measures directly.
On this particular roof, the shrub layer carries over a third of everything heard, with the canopy close behind; the air above (hawks, hummingbirds) is the rarest layer here. If you're designing a guild, this is the shape a listening record can hand you back: which layer is actually occupied, and which one is still empty.
What they're doing while they sing
What they do for you
The same detections, regrouped by role instead of species. Most birds do more than one job in real life; this sorts each one by its best-documented primary role, from published diet and nesting records, not anything we measured ourselves.
House Finch, Lesser Goldfinch, Mourning Dove, Song Sparrow, California Towhee, Dark-eyed Junco
Chestnut-backed Chickadee, Oak Titmouse, Wrentit, Black Phoebe, Bewick's Wren, Wilson's Warbler, Swainson's Thrush
American Crow, Steller's Jay, California Scrub-Jay, Common Raven
American Robin, Spotted Towhee
Red-shouldered Hawk, Great Horned Owl
Anna's Hummingbird
"Beneficial insect habitat" and "natural pest control" are claims a lot of habitat work sells without a way to check them. This is the receipt: real detections from the roof above, grouped by role.
One afternoon, walked
What one afternoon produced
Eight recordings down a single hillside, from the oak-and-shrub crest to the open grassland by the creek. Green is how much of each recording carried animal sound. Rust is insect and pollinator sound. Where two independent models agreed, we name the bird.
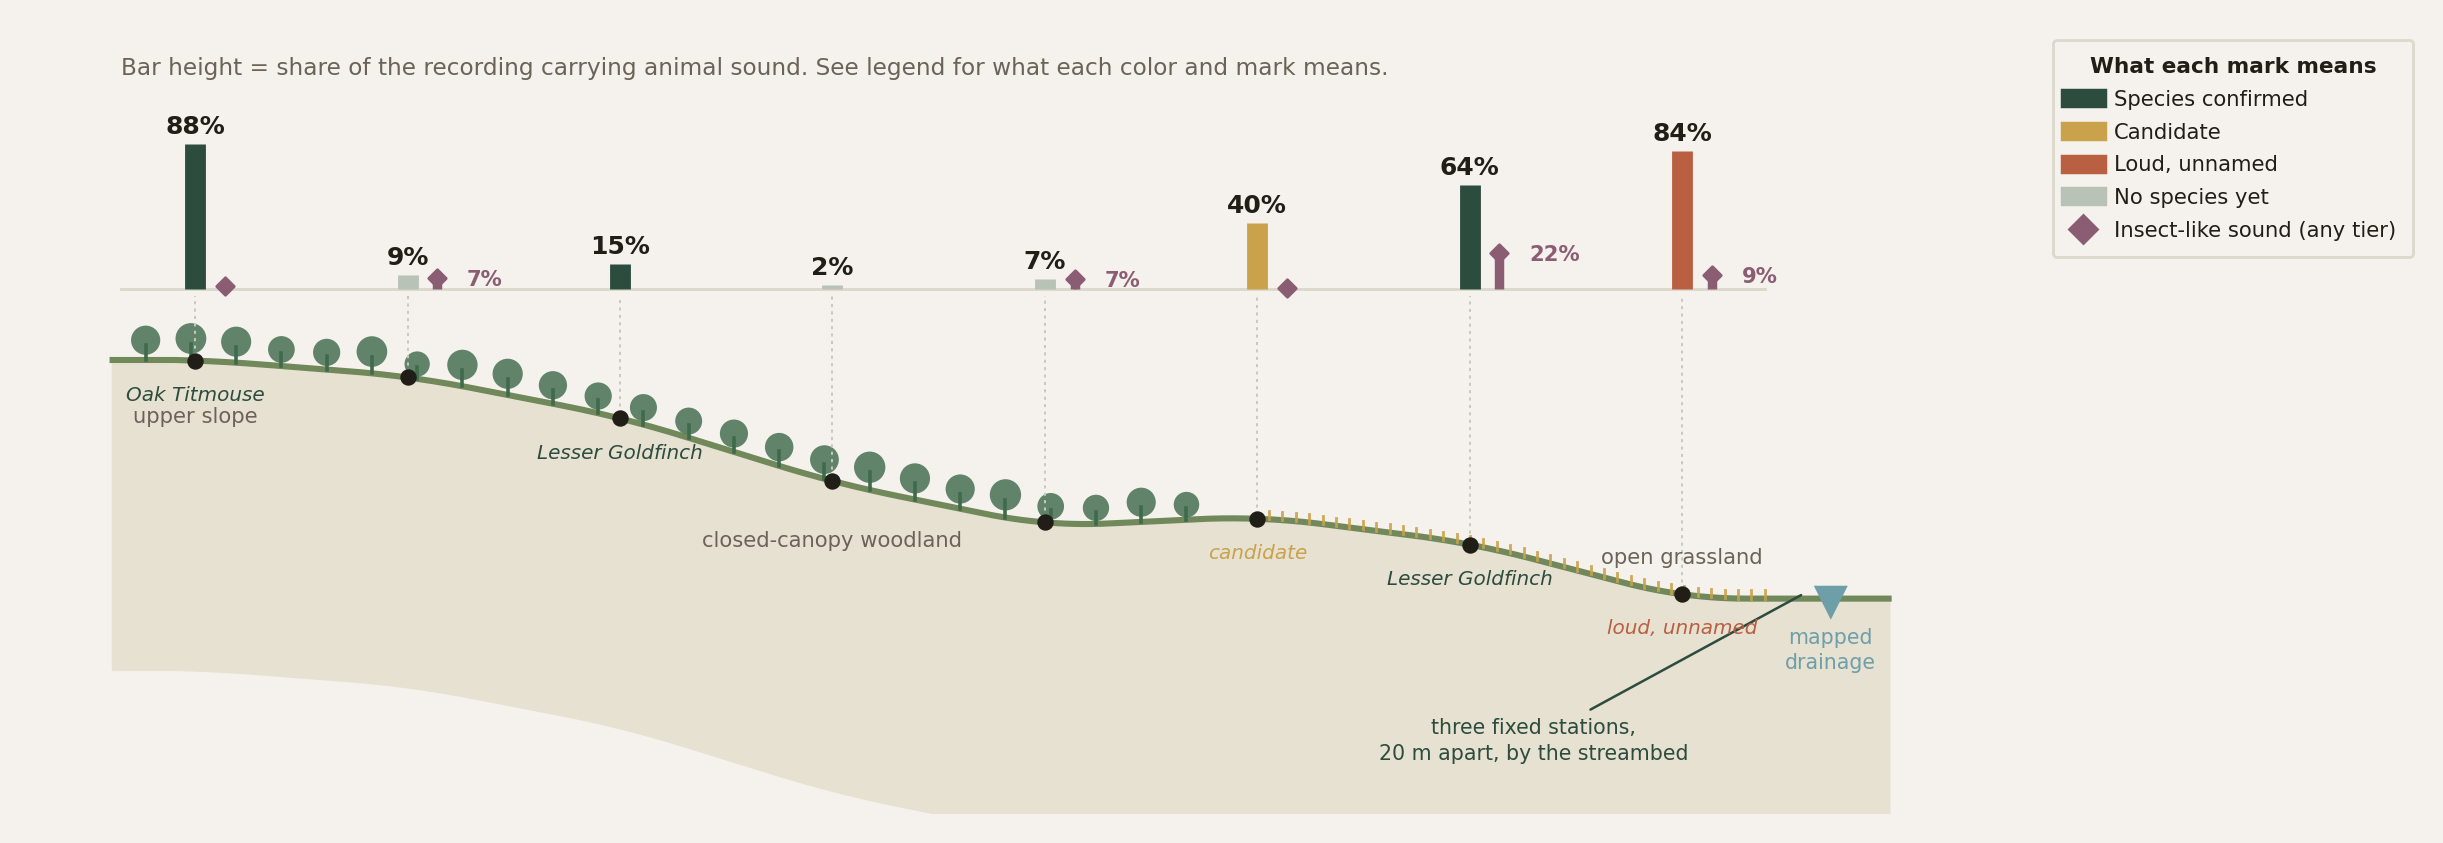
at the oak-and-shrub crest, the busiest place all day, with a confirmed Oak Titmouse.
insect sound at the edge above the creek, ten times any other stop, the kind of finding worth bringing to whoever's planning the pollinator strip.
spread between four recordings in the same woodland. A vegetation map would call all four identical.
One hillside, eight readings, a picture a map can't give you. The busiest ground for birds and the busiest for insects were at opposite ends of the slope, and the differences inside a single habitat type were as big as the differences between types. That is what listening adds to the layers you already have.
How a listening program actually works
Measure, act, measure again.
No single recording decides anything. One afternoon on a hillside tells you where to look. What tells you whether a decision worked is running the same loop twice around a change you made, and staying honest about the gap in between.
The walk
A walked recorder crosses the ground in half a day and finds where it's worth listening properly. It ranks candidates for a fixed station. It isn't the measurement.
The before
Ears go in and stay in: same spots, same schedule, week after week, so a visit becomes a time series. You get the species record with a confidence tier on every line, and the recorder hours behind it.
Your move
The grazing change, the water, the planting. Your ecologist, your PCA, your grazing adviser, your crew, your call. We don't design it or install it. We just write down the date it happened.
The after
Same season, same stations, same hours, read against ground you left alone. We agree beforehand what would count as it worked and what would count as that was just the weather.
This hands-on loop, walking the ground, setting fixed stations, coming back for a matched remeasurement, is the whole service in 2026. It's how we prove the method on real working land before we automate any of it. Where we're headed is simpler for you: Ears that just keep listening and reporting on their own, season after season, without a visit scheduled to make them useful. These field studies are how we earn that, one property at a time.
Step 1 · walk the ground
The walk that finds the questions
A walked recorder crossed roughly a quarter-mile of oak-studded grazing land. It was a resource mosaic of open grassland (forage & fuel), a wooded draw (shade & refuge) and a creek edge (water & sensitivity). Dot size shows where the land was most alive with sound, and where a permanent station earns its place.
How to read it
The headline
The grassland edges (stops 17 & 24) carried the most sound and the wooded draw the least. That's an activity map you can plan grazing, water and planting around.
The fixed test
A short walk west, three stationary Ears recorded the creek grove overnight. It is a candidate water, shade and sensitivity zone. That's the time-series test, detailed below.
Step 2 · what we heard at each stop
Loud is not the same as known
Every stop gets two scores, and we keep them apart on purpose. Acoustic activity is simply how much of the recording had animal sound in it. Species evidence is a stricter, separate test of whether we can actually name what made the sound. A place can be noisy and unidentified, or quiet and confirmed. Reading one as the other is the most common way this kind of data gets oversold. A walk like this is good at ranking where to go back. It isn't the measurement.
Activity counts any animal sound, birds, insects and frogs alike. It is not a bird count and not a health score. Habitat is the cover actually measured inside each recording's own location circle, rather than whatever polygon the pin happens to land on.
Look at stops 24 and 19. The grassland was the second busiest place all day and we still could not put a species to it. The quiet bay-maple draw at 15% is one of only three places where the species evidence cleared our bar.
So we know where the land is busy. That still doesn't tell you whether any of it matters to how the place gets managed. Next: put it against how the land is actually used.
Step 3 · what it means for management
Where heavy use meets fragile ground
Sound tells you where the life is. It doesn't tell you where that's a problem or an opportunity. Two things decide that, and they're independent of each other: how strongly a place draws use or production, and how much damage that place would take if it keeps getting used that way. We never roll them into one "good or bad" score, because a place can be heavily used and perfectly tough, or barely used and very fragile. It's where the two overlap that you get a management question worth answering. Below, that draw is cattle attraction, because this example is grazing land. On a vineyard or orchard it might be equipment routes and harvest timing; on a farm, foot traffic or irrigation demand. Same two axes, whatever kind of working land you run.
Quiet but fragile
Change here would be slow and easy to miss, which is exactly why it is worth a baseline.
Pressure meets fragility
If anything on the property is going to move, it moves here first. The most valuable place to have a before.
Least contested ground
Nobody is arguing over this corner, which makes it a good untreated comparison to read the rest against.
Working ground
Doing its job. Worth a station mainly to show that heavy use is not costing you anything.
On this grazing example, attraction is built from water, shade, forage and travel cost; sensitivity from banks, residual cover, oak recruitment, bloom and wildlife use. On this ground the creek grove is our hypothesis for high-draw by high-sensitivity: gentle footing, a forest, shrub and grass edge, a streambed metres away, which is why it's the first place we'd put a fixed station. It isn't a placement yet. No on-the-ground use was measured on this visit, so the draw axis stays an estimate until somebody walks it. The axes themselves carry over to any working land; only what fills them changes.
That's the case for where to listen properly. Next: stations that stay put, so the same spot can be compared to itself a year from now.
Step 4 · put permanent stations in
Twenty metres apart, and the land already sounds different
Fixed stations are what turn a visit into a time series. Even in one creek grove they read a wren-heavy core by the streambed giving way to a goldfinch edge where the shrub opens up. In a real program these aren't clustered for localization. They take three decision roles: treatment, matched comparison and high-quality reference.
Ear 1
southeastA wren-weighted activity core
Ear 2
westThe overlap edge, where goldfinch takes the lead
Ear 5, to the north, ran for part of the night only, so we've left it out of the counts above. It's on the map for scale, not for comparison.
Fixed stations are the backbone. In a full deployment the three roles spread across the mosaic as treatment, matched comparison and reference, recording for weeks across seasons on identical hardware, so every change is measured against a matched baseline instead of a memory.
Timing the return, and reading it honestly
When we come back, and how to tell weather from work
Ground doesn't change on a calendar year, so the return gets scheduled against the same seasonal window as the baseline, not a fixed date. Here's where that return tends to matter most across a typical season.
Peak forage and breeding. Where is the opportunity?
Where do shade & water shape use?
Did residual cover & fuel objectives coexist?
Did the move change the trajectory?
What this looks like on a real project
A creek crossing, and the year either side of it
Here's the most common restoration job on California working land, and where a listening program sits inside it. The stock have one dependable water source, so they stand in the creek. The banks are breaking down and no young willows are coming up. The fix is well understood: put water somewhere else, fence the reach for part of the year, plant the bank back. What nobody can usually tell you is whether it worked, or whether it was just a wet year.
The before
Markers go in at the creek reach being treated and at a similar reach left alone. Both get recorded on the same days, same gear. Bank condition, stubble height and willow counts get written down beside the audio.
This is the part that can't be done retroactively. Once the fence goes up, the before is gone.
Your move
Off-stream trough, seasonal fencing on the reach, willow and sedge planting. Your crew, your design, your call. We record the date it happened, because everything afterwards is measured from it.
We don't design or install. We're the instrument, not the contractor.
The after
Same stations, same season, same effort. Song at the treated reach either pulls away from the untreated one or it doesn't. Insect sound tends to follow the bloom coming back.
Bird response runs through vegetation structure, so expect at least a growing season of lag. This is a multi-year instrument.
What would say it worked
Activity at the treated reach rises against the untreated one, and the bank and willow counts move the same direction. Two independent things agreeing is the whole point.
What would say it didn't
Both reaches rise together. That's weather, not the fence. Without a comparison reach there's no way to tell those two apart, which is why we set one up before anyone acts, not after.
This is the part that's usually missing. Habitat work has always been hard to prove, not because the people doing it aren't careful, but because nobody can stand in a creek at four in the morning for two years straight. This doesn't make the claim for you. It gives you something to point at when a client asks how you know, including the times the answer is "it hasn't moved yet."
The shape of the answer
Before, and after you did the work
An invented example. Nobody has run this loop with us yet, so the numbers below are made up to show the shape of a finding, not a real result. Yours would come from your own two seasons of detections.
An invented example, because nobody has run this loop with us yet. The point is the gap between the two lines: if both rise together, that was the weather, not the work. Here, the treated reach pulls well ahead of the reach left alone, which is the shape that says the fence and the planting did something.
The deliverable
The Still Habitat Atlas
An evidence package built to support and defend a decision you make. Private by default, with sensitive locations removed unless you choose to share them. This is what a 2026 field study ends with. No one has received one yet. The first studies are what will shape it.
Private management-unit map
Forage, shade, water, sensitive habitat, infrastructure and station roles.
Two-page plain summary
What changed, how confident, the decision trigger and the recommended response.
Treatment · comparison · reference design
A defensible before/after you can actually repeat next season.
Forage, shade, water and habitat scorecard
Operational and ecological measures kept side by side, no single composite score.
Evidence ledger
Effort, review state, photos, GIS layers and uncertainty behind every claim. Recordings stay on your land; if you'd ever want clips in your own copy, that's your call to make, not our default.
Grant & planner annex
Methods, maps, outcomes and a monitoring budget for funding and stewardship.
The trust rule: every headline links to a station, date, valid effort, review state, land measurement, management action and comparison. A quiet or failed recorder is never read as biological absence.
How it fits together
Four ways to listen to land
In 2026 there's one way in: a hands-on field study on your land, run alongside whoever you already work with, a designer, a PCA, a grazing adviser. The single Ear follows in 2027, once a season of field studies has told us what it needs to be.
What we don't do. We don't design, plant, build or manage anything. No planting plans, no earthworks, no species lists to install, no advice on how to run your land. If you're working with a designer, a contractor or a grazing adviser, the plan stays theirs and we stay out of it. All we do is measure what's there beforehand and what changed afterwards, which is worth more coming from someone with nothing riding on the answer.
Field Studies
The founding pilot, where 2026 starts
Three to six Ears across an intervention area and a matched comparison for a week or more, plus a walking transect, site photography and a joint interpretation session.
The Atlas
Your landowner-facing record
The private management map, the plain-language summary, the forage, shade, water and habitat scorecard and the evidence ledger. The document you hand a planner, a funder, a board or a buyer, and the one your designer can point at to show their work landed.
Longitudinal Monitoring
The recurring baseline
We return in the same seasonal window after the work is done, on the same stations and effort, and measure what changed. A permanent Ear stays on the land in between.
Catbird Ear
The single Ear, on its own
One always-on Ear for a home, a roof, a garden or a paddock. Names species on device, publishes only the detection, and keeps listening year-round. It isn't for sale yet. Ears go on sale in 2027, once a season of field studies on real working land has told us what that means. Field-study properties get first call.
A species list is a good start. It isn't the finish. What we're really after is whether a land decision moved something, and whether it still shows next season.